Monday 31 October 2016

WHAT'S THE POPULATION OF EUROPE LIKE?

Europe's population is about 730 million people. The population of the 28 European countries that make up the European Union (EU) is 507 million people.
The population density of the EU is 114 per km2. Ireland and Greece have low population densities. Germany and the UK have high population densities.
The fertility rate of the EU is 1.6 children per family. Ireland and France have higher fertility rates. Portugal and Germany have lower fertility rates.
The EU's population is 52% female and 48% male.
The average age of people living in the EU is increasing. This can cause problems in the future because there are many retired people and fewer people working.
There are 28 countries in the EU. The EU's population contains many different ethnic groups. There's a lot of inmigration to the EU from non-EU countries. People also migrate from one EU country to another. The nationality with the highest number of people in the EU is German, and Turks are the largest inmigrant group. 7% of the people who live in the EU are inmigrants from non-EU countries.
Europe Population Density Map, from Online Maps by Rand McNally.

And now, let's play:

WHAT'S THE POPULATION OF SPAIN LIKE?

The population of Spain is about 46.7 million people. Spain has a low population density and it also has a low fertility rate.

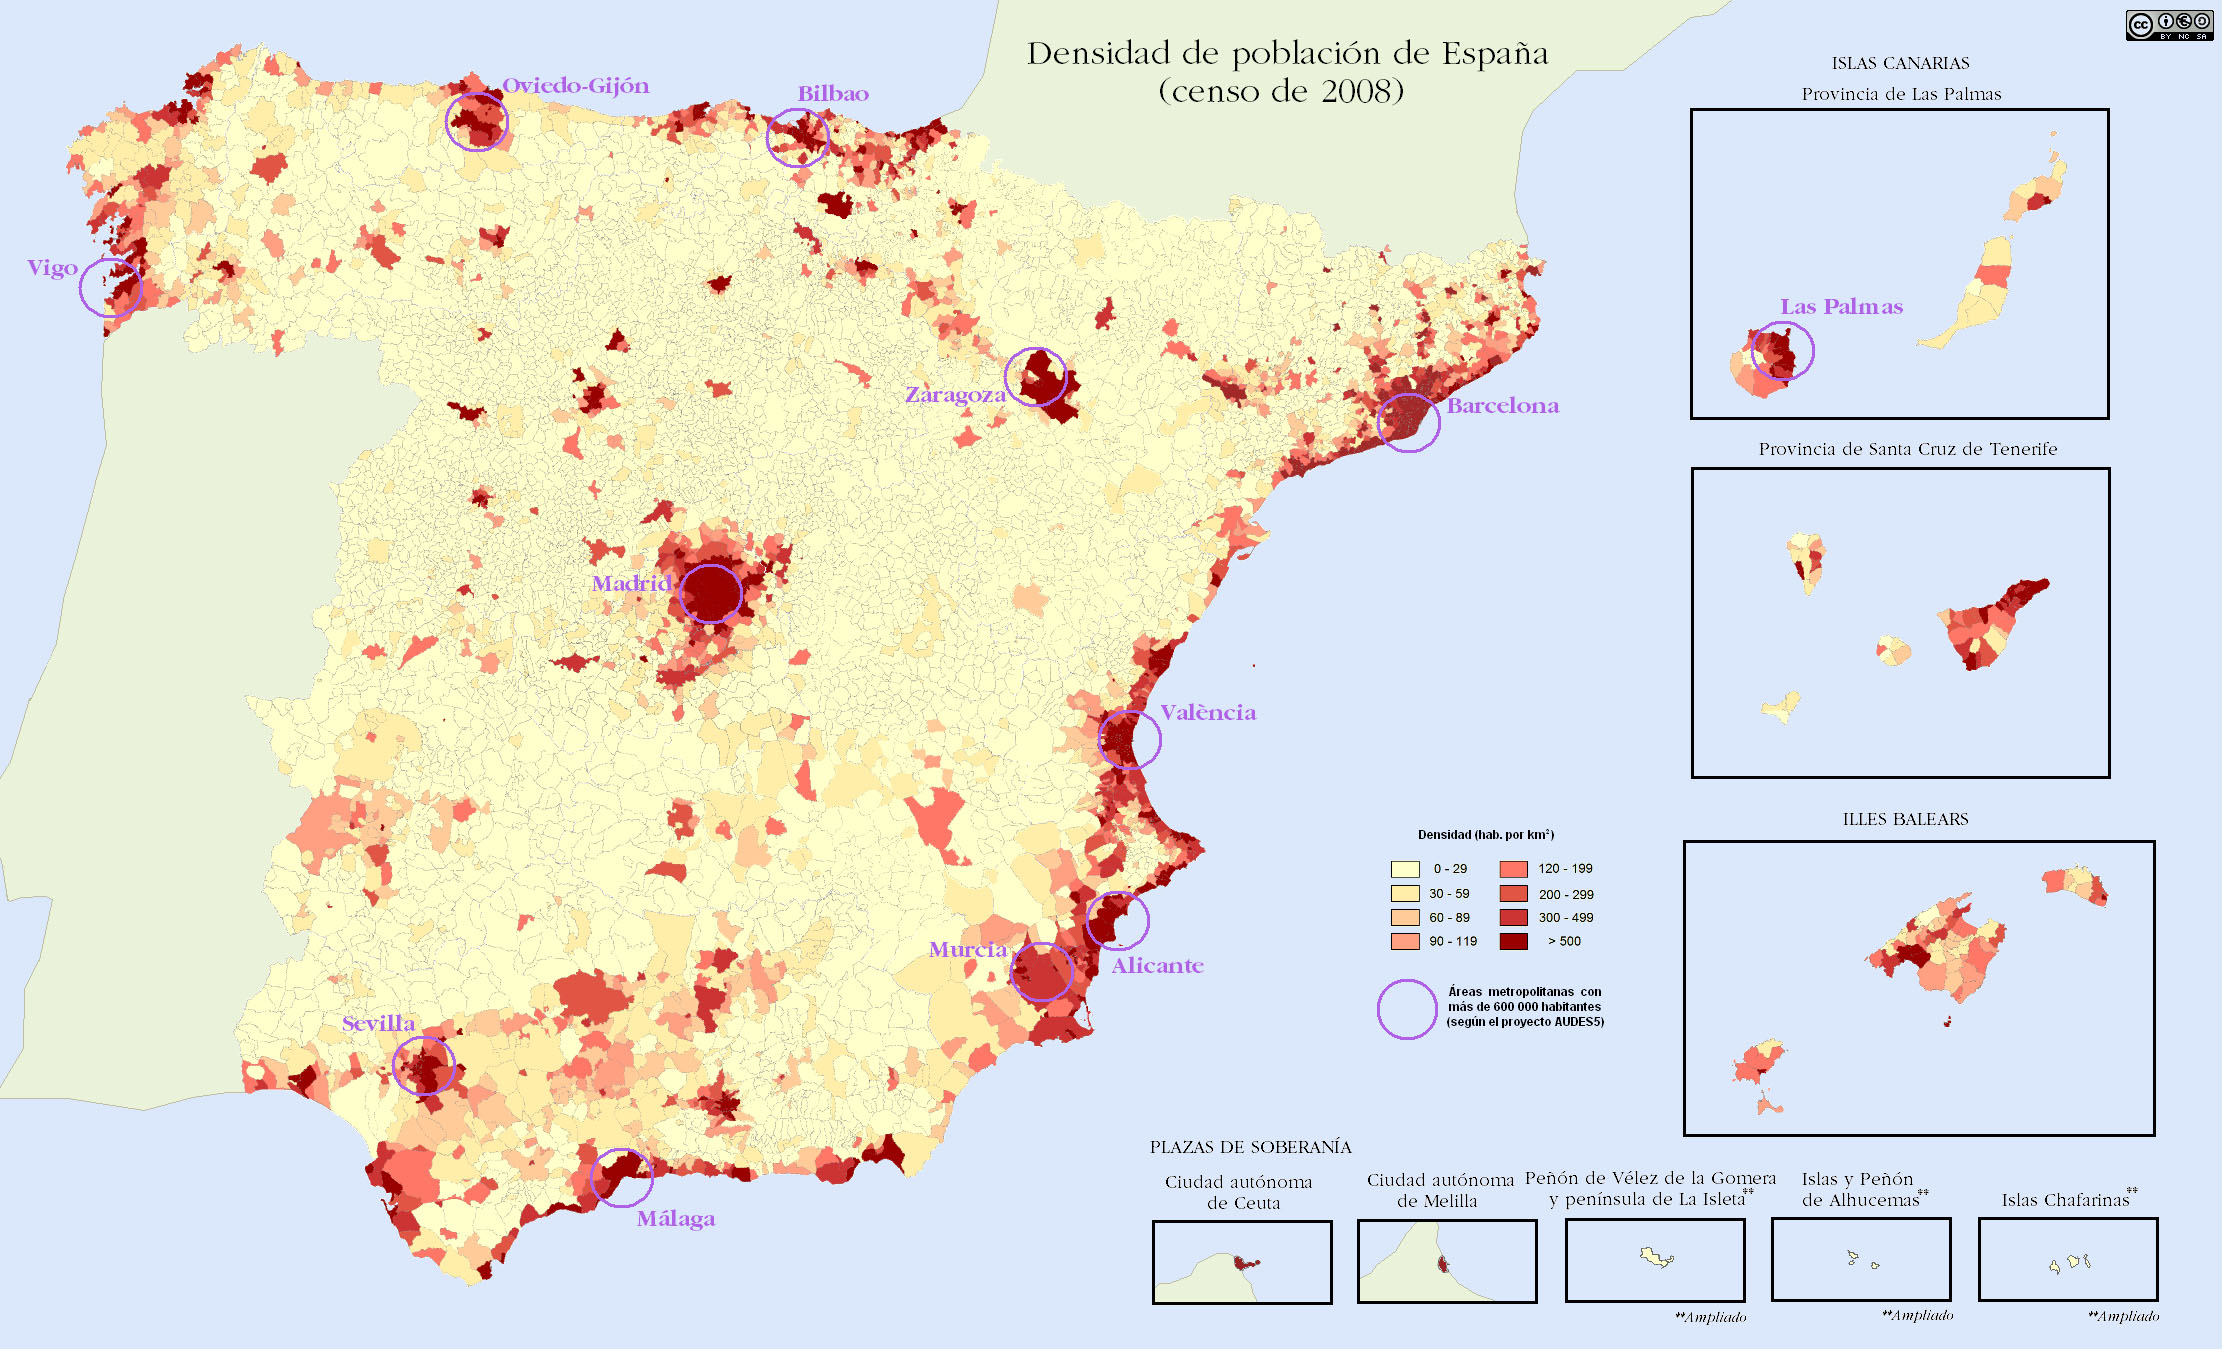
Population density:
Spain's population density is 91 per km2.
In some areas such as cities, there are many more people living in each square kilometre.
In rural areas, there are a lot fewer.
There is also a higher population density in coastal areas.
Spain's population density is lower than most other European countries.
Spain's Population Density. By Susana Freixeiro (Own work) [CC BY-SA 3.0 (http://creativecommons.org/licenses/by-sa/3.0)], via Wikimedia Commons

Fertility rate:
The fertility rate in Spain is 1.47 children per family. This is also lower than most other European countries.

Spain's population:
Spain's population has increased during the past century. Population growth was especially high from 2000 to 2011. This growth was the result of inmigration to Spain from other countries. In 2012, the population of Spain began to decrease as inmigrants returned home. This was because of high unemployment in Spain.
Spain's Population from year 1 to year 2015, from wikipedia.


Spain 1950-2014 Population pyramid.gif
By Zmzmzm2 - Own work, CC BY-SA 4.0, Link


WHAT POPULATION GROUPS ARE THERE?

We can divide the population of a country into groups according to various factors, such as gender or age.
Gender and age distribution:
Population can be divided into gender groups (males and females). We can also put people into different age groups. This information can be shown in a pie chart.


People that have a common language and culture form an ethnic group. This means that we can divide population into ethnic groups.
We can also divide population into groups according to religion.


Wednesday 26 October 2016

DIVIDIR POR DOS Y TRES CIFRAS


Para hacer divisiones de dos o tres cifras:
Tomamos tantas cifras del dividendo como tenga el divisor. Si las cifras del dividendo son más pequeñas que el divisor, hay que añadir otra cifra más en el dividendo.


Para comprobar si nos cabe o no, dividimos el primer número del dividendo (o los dos primeros si hemos añadido otra cifra) entre el primer número del divisor. Si no cabe, probamos con un número menos.


Una vez hecha la resta, bajamos la cifra siguiente y seguimos repitiendo estos pasos hasta que no haya más cifras.
 Pinchando en este enlace puedes practicar divisiones con dos cifras en el divisor.


Thursday 20 October 2016

KANDINSKY

En nuestra última sesión hemos estado trabajando sobre una de las obras de Kandinsky.
Ya os mostraré el resultado.
http://www.patchimals.com/recursos/colorea   
Foto de Patchworks
También podéis ver este vídeo sobre Kandinsky:

HOW DO WE REPRESENT POPULATION?


We can represent population using graphs and charts. We often use pie charts to show percentages and bar charts or line graphs to how changes in population. Pyramid graphs can be used to show age groups.
Pyramid graphs:
This pyramid graph shows us the age distribution of Spain's population in 2013. the blue bars on the left tell us how many males there are in each age group. The red bars on the right indicate the number of females in each group.
Spain's population 2014. Picture from theodora.com.
The longest bars indicate the highest number of people.

Pyramid graphs can also give us information about population growth.
Picture from Wikimedia Commons
Wider at the base: the population is increasing.

Picture from Class7ACCS
Wider in the middle: population grew rapidly in the past, but is now decreasing.

Picture from el captor
Wider at the top: the population is decreasing, and has been decreasing for many years.

 And now you can practice:
https://www.educaplay.com/es/recursoseducativos/2641736/how_do_we_represent_population.htm

Monday 17 October 2016

WHY DOES POPULATION CHANGE?

Many factors can affect population: people are born or die and people move around to find work or escape natural disasters and wars.

The fertility rate is the average number of children per family. The fertility rate in Europe is about 1.6. This number is calculated by dividing the total number of children by the total number of families.

Natural changes in population can happen when there are more births in a country than deaths.
This results in an increase in population. If there are more deaths than births, population decreases.

Migration is the movement of people from one area to another. People that live and work in one country, but are from another country, are called inmigrants. People that leave their country to live in a different one are called emigrants.
When there are more inmigrants than emigrants, population grows. If the number of emigrants is higher than the number of inmigrants population decreases.

Picture from pixabay.

And if you click on the next image you'll be able to play and learn:

https://www.educaplay.com/es/recursoseducativos/2634429/population.htm